FLOATING ISLAND INTERNATIONAL
  • Home
  • Solutions
    • Ponds & Lakes
    • Harmful Algae
    • Methane Mitigation
    • Shoreline & Asset Protection
    • Stormwater
    • Wastewater
    • Habitat
  • Technology
    • BioHaven
    • StreamBed Oxygenation
    • Floating Solar
    • Biofilm
    • BioHavens & Plastics
    • Wetlands
  • BioHaven Options
    • Products
    • DIY Planting & Launching
  • Research
    • Featured Case Studies
    • Study Summaries
    • Research Papers
  • Press
    • Articles
    • Featured Writings
    • Latest Posts
    • Guest Posts
    • Podcasts
  • Contact Us
    • Search

Floating Islands

an alternative to constructed wetlands for treatment of excess nutrients from agricultural and municipal wastes – results of laboratory-scale tests
By Frank M. Stewart, Tim Mulholland, Alfred B. Cunningham, Bruce G. Kania and Mark T. Osterlund

ABSTRACT

Constructed wetlands are recognized as effective mechanisms of water treatment and are employed in a variety of applications. Wetlands comprise diverse and complex systems of interacting plants and animals that remove contaminants from the water column by mechanical filtration and biochemical conversion. A major component of the wetland environment is microbial, with bacteria and other microorganisms proliferating upon all available submerged surfaces (i.e. substrate). In these wetland environments, microbial activity is limited by substrate surface area and nutrient flux. Consequently, the microbial contribution to wetland efficacy can be improved by increasing a wetland’s substrate surface area and increasing water circulation rates through that substrate. Various studies have investigated the use of floating wetland platforms to enhance wetland capacity; however, none of those studies has determined the specific contributions of microbes. In our study, we quantified the microbial component of BioHaven® Floating Islands for aerobic removal of ammonium, anoxic removal of nitrate, and simultaneous aerobic/anoxic removal of ammonium, nitrate and phosphate.
Picture
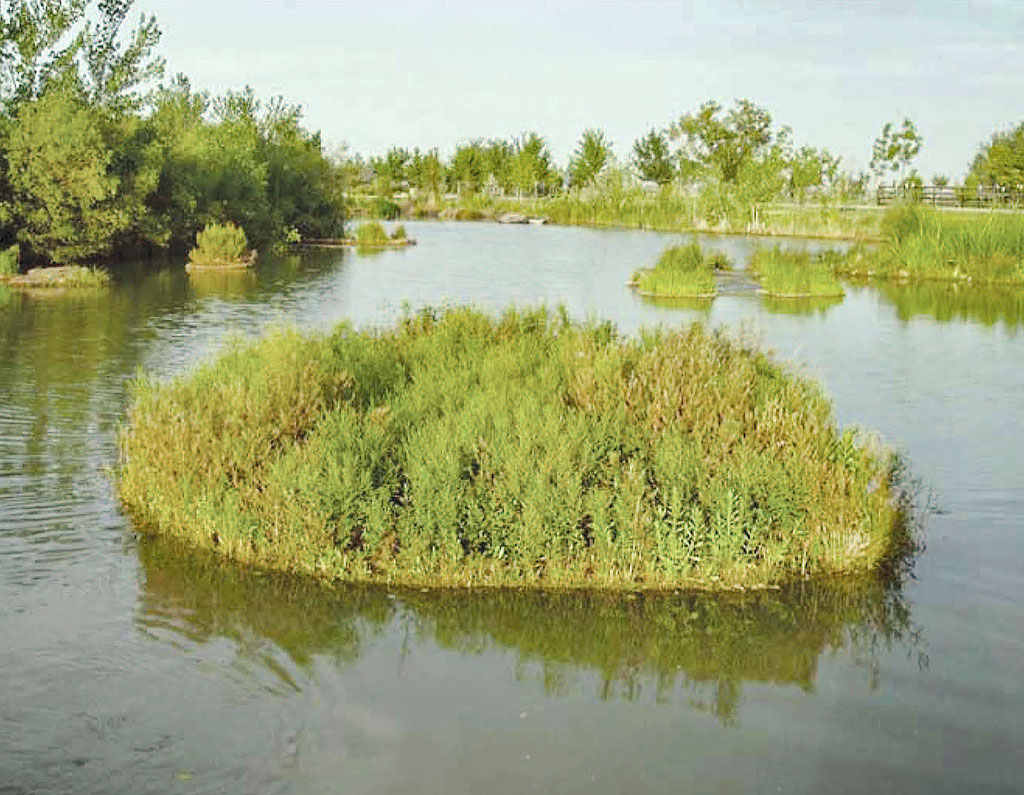
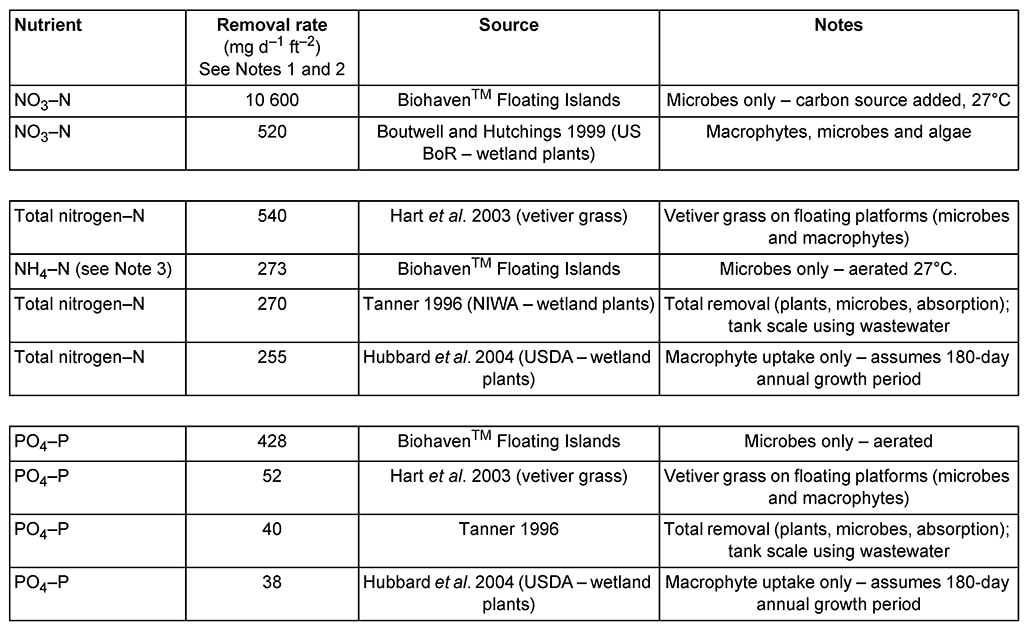
Figure 1A. A waterscape with several BioHaven® Floating Islands planted with native vegetation
This study establishes tank-scale standards to which other microbial data can be compared. In doing this, it has been determined that the microbes growing within a unit volume of BioHaven® Floating Island material are capable of removing 10 600 mg of nitrate per day, 273 mg of ammonium per day, and 428 mg of phosphate per day, where the unit island volume is defined as having a top surface area of 1.0 ft2 and a thickness of 0.6 ft.

Received July 2007; revised and accepted January 2008 Authors
Frank M. Stewart, Principal, Stewart Engineering, 3250 Prairie Smoke Rd., Bozeman, MT 59715, USA. Tel. 406-586-0790.
Email [email protected] (to whom correspondence should be sent)
Tim Mulholland, Principal Engineer, Lanyard Engineering, PO Box 2055, Billings, MT 59102, USA. Tel. 406-860-1589
Dr. Alfred B. Cunningham, Montana State University, Bozeman, MT, USA. Tel. 406-586-5563
Bruce G. Kania, Floating Island International, PO Box 252, Shepherd, MT 59079, USA. Tel. 406-373-5200
Dr. Mark T. Osterlund, Floating Island International, PO Box 252, Shepherd, MT 59079, USA. Tel. 406-373-5200

INTRODUCTION

Expanding human populations and intensive agricultural practices have had direct negative impacts on many aquatic environments. One result has been the introduction of chemical nutrients at concentrations that have contributed to poor water quality. Critical nutrients frequently observed at elevated levels within our water systems include nitrogen and phosphorus. Sources of these nutrients include municipal sewage, livestock waste and crop fertilizers. Impacts of eutrophication (highly nutrified water) can include toxicity to humans and animals via ingestion, dramatic and unsightly algal growth; oxygen deficiencies that vitiate support of aquatic life, and odors generated from decaying organic matter.

Two possible solutions to the eutrophication of our lakes, rivers, and ponds are: (1) prevention through a radical change in our lifestyles; and (2) water treatment to remove existing contaminants, including excess nutrients. Radical lifestyle changes are a worthy pursuit; however, the scope and significance necessary to reverse the damage would make it a challenging option. Treatment, as an alternative in many forms, is more within our reach. Most industrialized countries currently rely heavily upon mechanical treatment to improve the quality of the water emitted from their wastewater facilities. While those techniques generate high-quality water, they can be expensive to maintain; they require costly upgrades when populations expand; and they ignore non-point-source agricultural impacts – they only treat wastewater. An alternative to the mechanical treatment of water is the implementation of treatment wetlands.

Wetlands rely upon natural processes to mechanically and biologically filter water as it passes slowly through shallow areas of dense aquatic vegetation, and through permeable bottom soils. Research has shown that constructed wetlands significantly reduce aquatic pollutants, especially nutrients, without requiring extensive maintenance and upkeep (Tchobanoglous et al. 2003). The primary mechanisms for nutrient removal are microbial transformation and uptake; macrophyte assimilation, absorption into organic and inorganic substrate materials; and volatilization. While the system can be complex, with various plant and microbial species occupying specific niches, the size of the wetland is one of the greatest indicators of its effectiveness.

Surface area is essential for bacterial growth within a wetland. More surface area allows for a larger bacterial population and therefore greater nutrient uptake. Sprawling wetlands provide one method of increasing that surface area; floating treatment wetlands provide an alternative (Figure 1A).

Floating treatment wetlands differ from conventional constructed wetlands in that the microbes and macrophytes grow on and within floating platforms, and the macrophytes extend roots into the water where they take up nutrients hydroponically (Figure 1B). In contrast, the roots of conventional wetlands grow into pond-bottom soils and are therefore not in direct contact with nutrient-rich surface-flow water. The roots from floating wetland plants also provide an additional submerged surface area to support the growth of microbes. As more roots grow, more surface area is created, thereby improving the effectiveness of the system as it matures. Nutrient-rich water can optionally be circulated through the platforms via use of submerged pumps that are powered by wind, solar or conventional electrical power. We hypothesize that the effects of an expansive internal surface area for colonizing bacteria, in combination with improved nutrient transport to the bacteria, make relatively small floating platforms function with an efficiency equal to much larger traditional wetlands. Other benefits of floating treatment wetlands are that they accommodate fluctuating water levels; they can support either terrestrial or aquatic plants (although aeration is typically required for terrestrial plants); they can function in cold temperatures via vertical circulation of relatively warm bottom water up to the microbes colonizing the internal portions of the floating structures; and they can be introduced into almost any existing water system, regardless of depth or shape.
A cross-section illustration of a floating treatment wetland
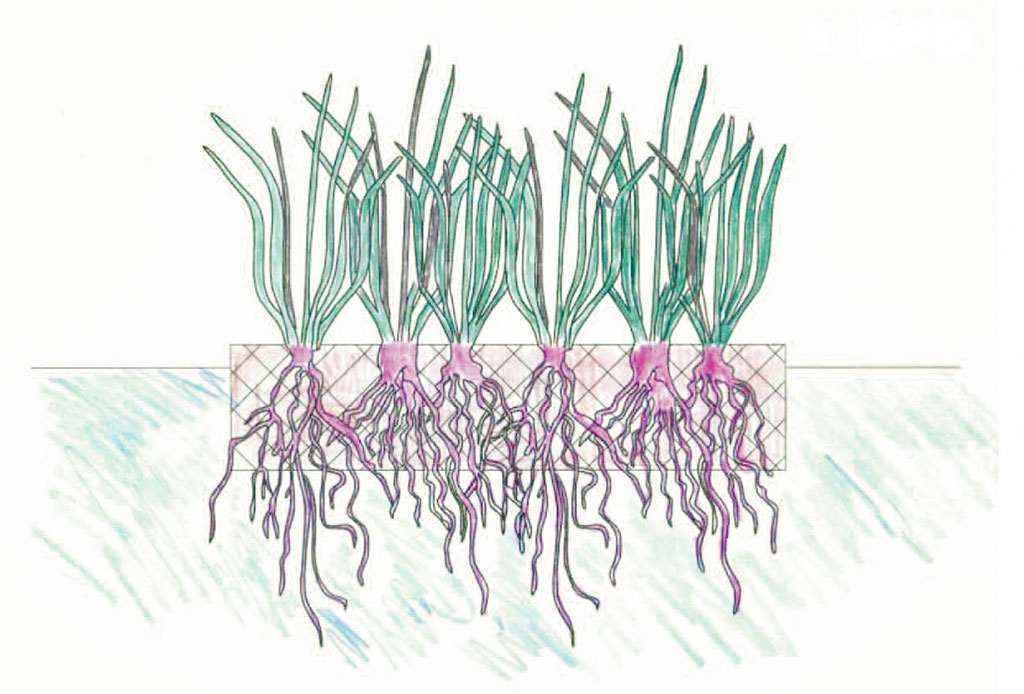
Figure 1B. A cross-section illustration of a floating treatment wetland. Plants grow on a buoyant matrix that allows roots to penetrate into the water. The floating system allows terrestrial plants to grow above the water line, while roots take up nutrients and water below the island.
Several studies have investigated the effectiveness of floating treatment wetlands (Boutwell and Hutchings 1999; Hart et al. 2003; Hubbard et al. 2004); however, the variability between the studies makes it difficult for direct comparison (for example, Hubbard measured nutrient uptake by macrophytes only; Hart measured uptake by macrophytes, microbes and abiotic mechanisms; and Boutwell included uptake by algae as well as macrophytes, microbes and abiotic mechanisms). In this study, we were interested in investigating only the bacterial activity associated with floating treatment wetlands.

Microbial removal was selected as the primary focus because it was expected to be the dominant effect (Gersberg et al. 1986), and also because nutrient removal by macrophytes in floating platforms has been well quantified by previous research (Hubbard et al. 2004). Thus, this study should provide a benchmark which can be used to compare future studies.
The floating treatment system used for this study is the BioHaven® Floating Island. The island bodies primarily comprise fine (0.007-inch diameter) polymer strands that are intertwined and bonded to provide a three-dimensional non-woven matrix that is highly porous, permeable, and resistant to environmental degradation. The individual polymer strands provide an ideal substrate for colonization by microbial biofilms, and the matrix also provides an excellent growth medium for the roots of aquatic, riparian and terrestrial plants. The new matrix is approximately 5% fibers and 95% pore space by volume. Gas-filled plant roots as well as biogases (principally nitrogen and carbon dioxide) generated by microbial metabolism provide buoyancy for the islands. Polymer foam provides additional buoyancy as required when it is injected as discrete plugs into the porous matrix, where it expands into the matrix pores and then bonds around the matrix fibers. A photograph of a BioHaven® Floating Island is shown in Figure 1A, and a cross-sectional schematic is shown in Figure 1B.

The three nutrients that were studied in this project were nitrate, ammonium, and phosphate. Due to runoff from irrigation and precipitation, these nutrients frequently accumulate in various waterways and contribute significantly to poor water quality. Floating treatment wetlands reduce excess aquatic nutrients biologically by a combination of plant and microbial activity (plants utilize nitrate as a nutrient source, and anoxic bacteria use it as a respiratory electron acceptor). In this study, we evaluated the microbial component of biological nutrient removal.

Nitrates are a major component of chemical fertilizers that are applied both agriculturally and residentially. During one portion of this study, nitrate-rich liquid fertilizer was introduced into tanks with and without floating islands. The experiments were designed to promote conversion of nitrate to nitrogen gas by anoxic, denitrifying bacteria; consequently, no aeration was provided during those tests.

A second portion of the study involved experiments to remove ammonium. Municipal wastewater and livestock effluent lagoons are typically high in ammonium, but low in nitrate, because microbial breakdown of organic material in wastewater depletes the available dissolved oxygen, and microbial conversion of ammonium to nitrate requires oxygen for its aerobic respiratory process.

On floating islands, ammonium is removed by bacteria via a two-step process similar to that used in standard biological wastewater treatment facilities. In the first step of the process, ammonium is aerobically converted to nitrite, then to nitrate by nitrifying bacteria. In the second step, anoxic bacteria convert nitrate to nitrogen gas. In this study, we were able to demonstrate that the aerobic and anoxic steps could be accomplished within a single island in sequential steps, resulting in conversion of ammonium to nitrogen gas by a single island exposed to limited but constant aeration in combination with alkalinity adjustment and organic carbon dosing.

The final portion of the study consisted of experiments that demonstrated simultaneous removal of nitrate and phosphate. Phosphate is typically present in both nitrate-rich agricultural runoff and ammonium rich wastewaters. In many cases, phosphate is the limiting nutrient that controls algae blooms and resulting die-offs in lakes and reservoirs. In this study, we demonstrated simultaneous microbial removal of nitrate and phosphate by a combination of anoxic and aerobic bacteria that colonized the islands in the presence of controlled aeration.

This study reveals dramatic microbial nutrient removal associated with BioHaven® Floating Islands.

The removal rates recorded in this study exceed most previously recorded measurements for other floating treatment wetlands that contain both microbes and macrophytes. Comparative results for the floating islands and other systems are described in detail in the Results and Discussion sections.
METHODS
 
Experimental design

Tests were conducted in 30-gallon polyethylene tanks that contained 20 gallons of municipal water (< 1 ppm residual total chlorine), which was spiked with 1 litre per tank of well-water in order to provide a starting bacteria population (the well-water was from a shallow, contaminated agricultural well that was expected to contain nitrifying and denitrifying bacteria). Schematics of the tank setups are shown in Figure 2.

Tank water temperature was set at 27°C with sub-merged heaters. The tanks were painted black and covered with loose-fitting tops to minimize light entry (and resulting algae growth) while providing gas venting.

BioHaven® Floating Islands were simulated by placing non-woven polyester blankets in tanks so that the blankets were mostly submerged with their tops at the water line. The non-woven material used in the tests was the same material used to manufacture the floating islands. Each island blanket was two feet long, one foot wide, and seven inches thick.
Experimental setup showing circulation and aeration within each test
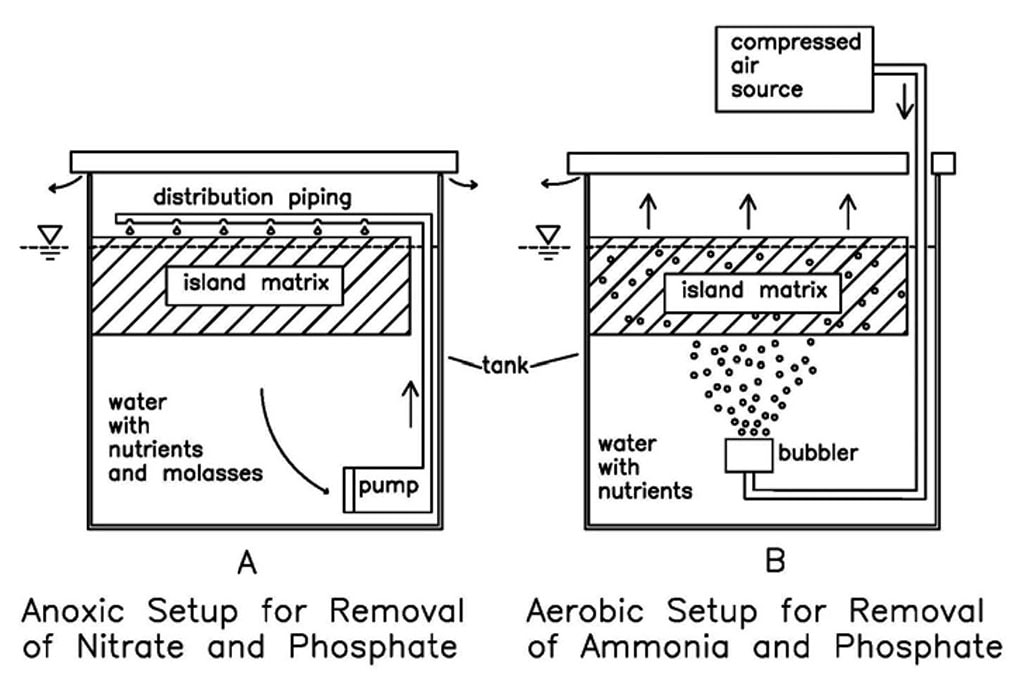
Figure 2. Experimental setup showing circulation and aeration within each test. Floating islands (island matrix) are represented with slashes and are positioned at the surface of the water within the test tanks. Setup ‘A’ shows a circulation setup in which water is pumped from the bottom of the tank and distributed above the island. This setup should result in an anoxic aquatic environment which will remove nitrate and phosphate. Setup ‘B’ shows an aeration setup in which compressed air is forced to the bottom of the tank and allowed to bubble up through the islands. Compressed air is forced through a bubbler to facilitate its distribution. This setup should result in an aerobic aquatic environment which will remove ammonia and phosphate.
Submersible aquarium pumps (nominal water flowrate 0.8-gal min–1) and/or bubblers (nominal air flowrate 0.03 ft3 min–1) circulated water through the tanks. In tanks containing islands, pumps and bubblers were positioned so that water circulated through the islands (see Figure 2).

The non-woven island blankets were presoaked in water containing nutrients and well-water bacteria for approximately seven weeks prior to data collection, in order to allow a biofilm community to develop on the island substrate prior to the experiments.

Nutrients

Nutrients were provided by dosing the tanks with a combination of commercial liquid hydroponic fertilizers (FloraMicro® and FloraBloom®) and a dry chemical (ammonium chloride). FloraMicro® (5-0-1) was used as a source of nitrate; FloraBloom® (0-5-4) was used as a source of phosphate; and ammonium chloride was used as a source of ammonium. The liquid hydroponic fertilizers contained several micronutrients in addition to the primary nutrients. Food-grade molasses was used as the carbon source. Molasses concentrations were added in excess of the requirements to convert all of the nutrients in each experiment and were determined experimentally in screening runs (not shown) by tracking total organic carbon uptake versus nutrient removal.
Graph of nitrate removal rates in the anoxic experiment
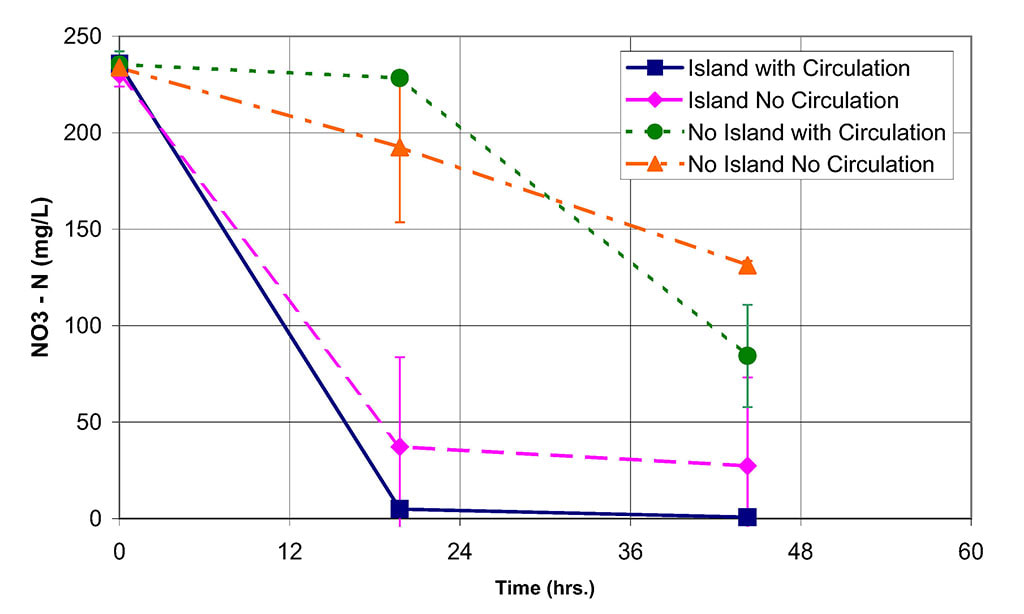
Figure 3. Graph of nitrate removal rates in the anoxic experiment. Nitrate concentrations (mg L–1) are shown for four different test conditions where measurements were taken at 0 hours, 20 hours, and 44 hours. Test conditions include tanks with and without islands, and tanks with and without circulation (see legend). Each test was performed in triplicate, with average concentrations represented on the graph. Error bars indicate standard deviations.
Starting nutrient concentrations were selected to simulate wastewater concentrations, based on a literature survey and measurements taken from samples collected at one concentrated animal feedlot operation (CAFO) pond. Initial nutrient concentrations were approximately as follows – for the aerated ammonium/nitrate experiments: 200 mg L–1 ammonium (NH4 – N), 10 mg L–1 phosphate (PO4 – P); for the non-aerated nitrate experiments: 230 mg L–1 nitrate (NO3 – N), 10 mg L–1 phosphate (PO4 – P); for the aerated nitrate/ phosphate experiments: 230 mg L–1 nitrate (NO3 – N), 16 mg L–1 phosphate (PO4 – P).

For the aerated ammonium/nitrate experiments, 300 mg L–1 powdered calcium carbonate was added twice (days 6 and 7) during the run, in order to replace the alkalinity that was consumed by the conversion of ammonium to nitrite.

For the aerated ammonium/nitrate experiments, 800 mg L–1 molasses was added at startup, and 3400 mg L–1 additional molasses was added on Day 9 and Day 13. For the anoxic nitrate experiment, 1600 mg L–1 molasses was added at startup. For the aerobic nitrate/ phosphate experiment, 2400 mg L–1 molasses was added at startup.

Measurements

Nutrient removal rates were quantified by periodically collecting and analyzing tank-water nutrient concentrations by colorimeter (Hach Model 890). Ammonium, nitrate, and phosphate were each measured using established protocols provided by the colorimeter manufacturer (Method 10031, nitrogen, ammonium, high range; Method 10020 nitrate, high range; Method 8048 phosphorus, reactive). Samples were diluted as required with distilled water if the nutrient concentrations were above the upper limit of the measurement technique. Results are presented in units of milligrams of nutrient removed per day per square foot of island top surface (mg d–1 ft–2) where ‘top surface’ is the width times the length of a rectangular island viewed from above (island thickness is 0.6 ft for all experiments). Experiments were run in batch mode with triplicate replicates.

The pH was measured using an electronic tester with double-junction probe. Oxidation–reduction potential (ORP) was measured with an electronic tester with an ORP probe.
RESULTS
 
Nitrate removal

Results of the nitrate experiments are shown graphically in Figure 3. In tanks containing floating islands, nitrate was virtually eliminated within 24 hours. The calculated removal rate for the island tanks with circulation was 10 600 mg d–1 ft–2, compared to 1907 mg d–1 ft–2 in the tanks with circulation but no islands. As shown in the figure, the benefits of circulating water through the islands were of minor significance for this experiment.

In tanks containing islands and circulation, ORP values decreased from +200 mV to –200 mV over the duration of the experiment (a change of –400 mV). In the tanks with circulation but no islands, ORP values decreased from +200 mV to +48 mV (a change of –152 mV, data not shown).
Graph of ammonium removal rates in the combined ammonium and nitrate removal experiment
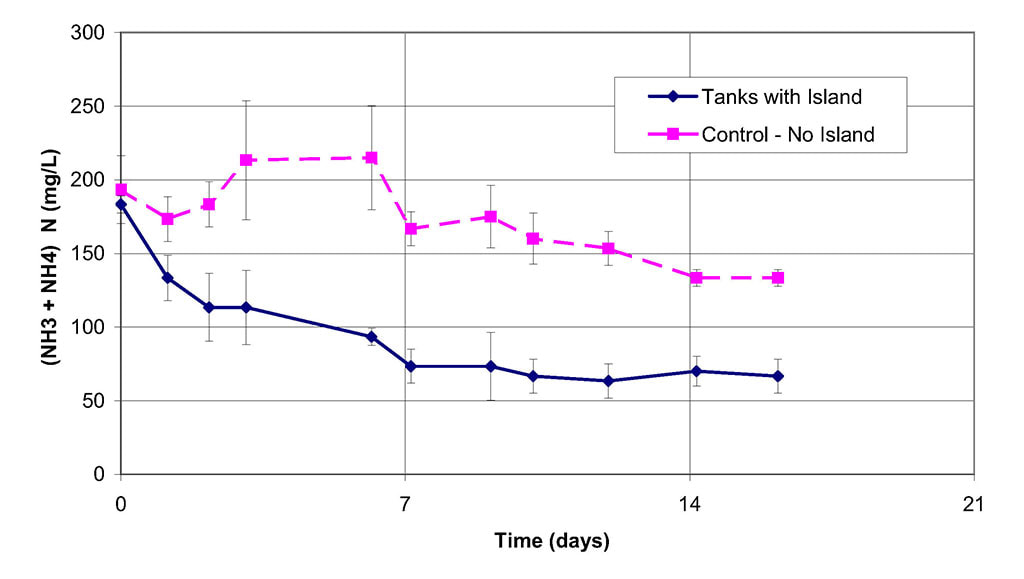
Figure 4. Graph of ammonium removal rates in the combined ammonium and nitrate removal experiment. Ammonium concentrations (mg L–1) were measured for two test conditions (tanks with islands and control tanks without islands) at twelve times over a period of 29 days. Each test was performed in triplicate, with average concentrations represented on the graph. Error bars indicate standard deviations.
Combined ammonium and nitrate removal

Ammonium removal results are shown in Figure 4. During the first nine days of the run, the average ammonium removal rate for the island tanks was 457 mg d–1 ft–2. For the entire run of 16 days, the average removal rate for the island tanks was 273 mg d–1 ft–2. The removal rates in the controls were about 50% of the removal rates for the island tanks.

Nitrate production and removal results are shown on Figure 5. At the beginning of the experiment, there was no significant nitrate in either the controls or the island tanks, as expected. Over the first nine days of the experiment, nitrate increased in the island tanks to about 131 mg L–1 – a result of bacterial nitrification of ammonium. Nitrate concentrations did not increase in the control tanks. When molasses was added to the tanks on Day 9, nitrate concentrations in the island tanks decreased rapidly (removal rate of 3600 mg d–1 ft–2) until these concentrations reached about 32 mg L–1, at which point the removal rate slowed.
 Graph of nitrate production and removal rates in the combined ammonium and nitrate removal experiment
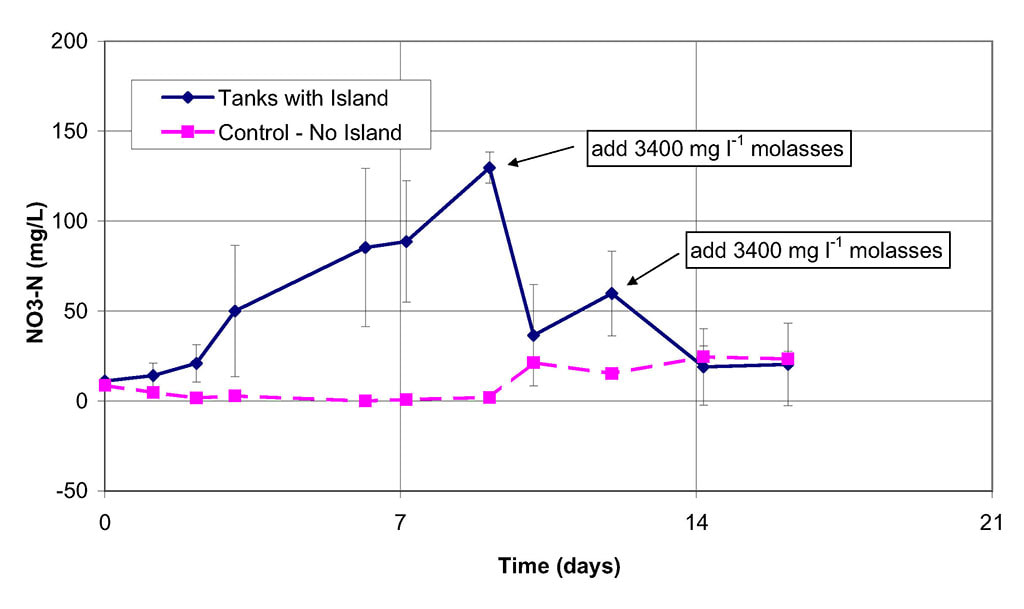
Figure 5. Graph of nitrate production and removal rates in the combined ammonium and nitrate removal experiment. Nitrate concentrations (mg L–1) were measured for two test conditions (tanks with islands and control tanks without islands) at twelve times over a period of 29 days. Each test was performed in triplicate, with average concentrations represented on the graph. Error bars indicate standard deviations.

Graph of phosphate removal rates in the combined nitrate and phosphate removal experiment
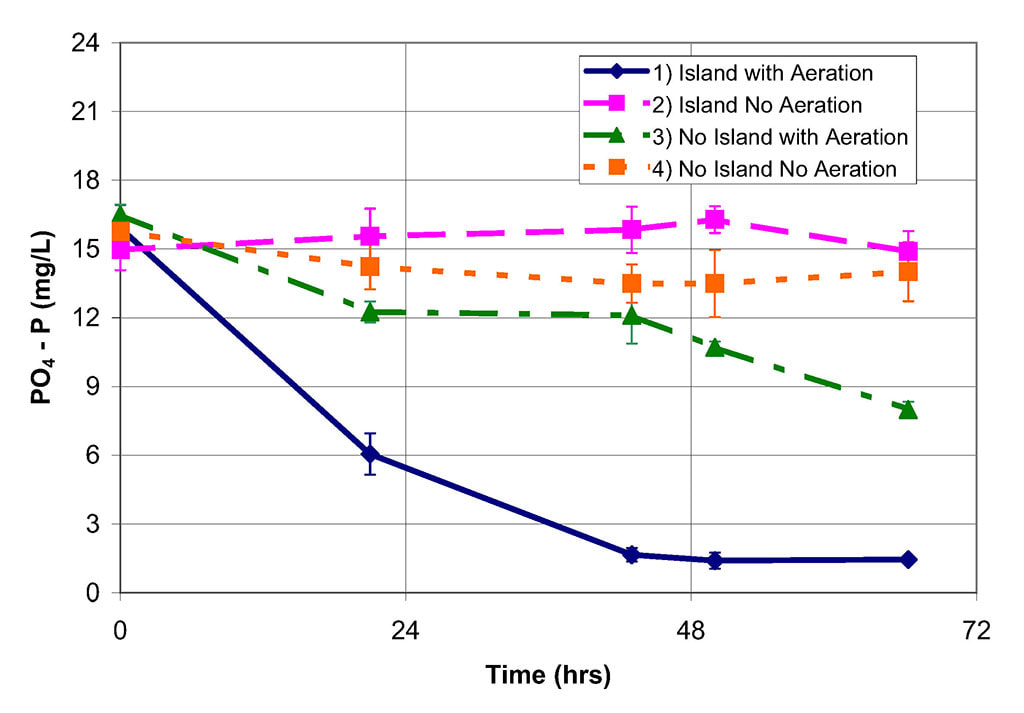
Figure 6. Graph of phosphate removal rates in the combined nitrate and phosphate removal experiment. Phosphate concentrations (mg L–1) were measured for four test conditions at 0, 21, 42, 50 and 65 hours. Test conditions included tanks with and without islands, with and without aeration. Each test was performed in triplicate, with average concentrations represented on the graph. Error bars indicate standard deviations.
Combined phosphate and nitrate removal

Phosphate removal results are shown in Figure 6. During the first 22 hours of the experiments (when the phosphate concentrations were highest), the microbial activity associated with aerated floating islands reduced the concentration of phosphate at a rate of 428 mg d–1 ft–2, which was about twice the removal rate achieved in aerated controls. The non-aerated tanks produced very little phosphate removal, regardless of the presence of islands. Importantly, nitrate removal rates (not shown) were quite high (about 9000 mg d–1 ft–2) in the island tanks under these aerated conditions, indicating once again that the islands were simultaneously supporting both anoxic and aerobic microbial activity within a single system.

DISCUSSION
 
Comparison of results with other studies

The results from four previous studies by other researchers were compared to our results and are summarized in Table 1. All of these previous studies involved tank-scale experiments, which typically occur over shorter time spans than full-scale wetland tests.

In the first study (Hart et al. 2003), floating mats of Australian vetiver grass was grown in 20-litre drums, with roots expanding to the bottom of the drums. The drums were filled with wastewater (motel septic effluent). The starting concentrations were ammonium, 93 mg L–1; total nitrogen, 99 mg L–1; total phosphorus, 10 mg L–1. Total nitrogen removal was monitored for four days, at which time total nitrogen was down to 6 mg L–1. In the second study (Hubbard et al. 2004), floating rafts of wetland plants were placed in 1285-litre tanks that were filled with swine lagoon wastewater (total nitrogen, 160 mg L–1; total phosphorus, 30 mg L–1).
Summary of nutrient removal results from selected sources
Table 1. Summary of nutrient removal results from selected sources
Notes:
Unit (mg d–1 ft–2) is mg of nutrient removed per day per square foot of island top surface.
Removal rates reported in previous research have been converted to units of (mg d–1 ft–2) by the authors of this paper.
Total nitrogen in wastewater is typically predominantly ammonium.

The wastewater was replenished periodically to maintain high strength in the tanks. Nutrient uptake was measured by analyzing the nutrient content of the macrophytes biomass produced; therefore, it did not include removal by microbes. The study was conducted over an 18-month period (two summer seasons). In the results presented below that calculate removal on a daily basis, we have assumed that the plants had a nine-month annual growth period (the experiments were conducted at Tifton, Georgia, USA).

In the third study (Boutwell and Hutchings 1999), platforms with several species of wetland plants were floated in 160-gallon tanks that were filled with partially treated and diluted sewage effluent containing about 21 mg L–1 nitrate, 0.1 mg L–1 ammonium, and 0.04 mg L–1 phosphate. The experiments were run for 28 days, although nitrate was 80% removed by Day 7. The controls in this experiment consisted of tanks without islands, and nutrient removal by algae in the control tanks was significant.

In the fourth study (Tanner 1996), eight species of wetland plants were grown in 50-gallon tanks that contained gravel and pre-treated dairy wastewater (total nitrogen, 98.5 mg L–1; total phosphorus, 14.6 mg L–1). Average temperature was about 11°C (which was significantly cooler than the temperatures used in the floating island research). The experiments were run for 124 days. Nutrient uptakes were measured for plants alone and also for all mechanisms (plants, microbes, adsorption, etc.).

A comparison of our results and the four other projects is shown in the Table 1. As shown in the table, the BioHaven® Floating Islands dramatically outperformed the products tested by other researchers for removing nitrate and phosphate and outperformed all but one product (Vetiver grass – Hart et al. 2003) for total nitrogen/ammonium. The results of the Hart study indicate that a combination of microbes and actively growing macrophytes provides the best option for removing ammonium. By combining macrophytes with bacteria in future versions of BioHaven® Floating Islands, we expect to boost the performance of these products for removing ammonium and other nutrients.

Home
Stewardship
Case Studies
Floating Solar
Storm Water
Articles
Wastewater
Technology
Testimonials
Shoreline
Products
About Us
HAB's
Research
Partners
Contact Us
In the News
Blog

© Copyright Floating Island International, Inc. All Rights Reserved - Privacy Policy